The full data set containing 289 million tick events based on real trading data is now available for download on Zenodo under CC by-nc-sa license: here.
Call for Grand Challenge Solutions
The DEBS Grand Challenge is a series of competitions that started in 2010, in which both participants from academia and industry compete with the goal of building faster and more scalable distributed and event-based systems that solve a practical problem. Every year, the DEBS Grand Challenge participants have a chance to explore a new data set and a new problem and can compare their results based on the common evaluation criteria. The winners of the challenge are announced during the conference where they are competing for a performance and an audience award. The winning team of the performance award will receive 1000 USD as prize money sponsored by Infront. Apart from correctness and performance, submitted solutions are also assessed along a set of non-functional requirements.
Topic: Technical Analysis of Market Data
The 2022 DEBS Grand Challenge focuses on real-time complex event processing of real-world high-volume tick data provided by Infront Financial Technology (https://www.infrontfinance.com/). In the data set, about 5000+ financial instruments are being traded on three major exchanges over the course of a week. The goal of the challenge is to efficiently compute specific trend indicators and detect patterns resembling those used by real-life traders to decide on buying or selling on the financial markets.
Further details on the data set provided, the queries, non-functional requirements and the overall submission process can be found here: https://2022.debs.org/call-for-grand-challenge-solutions/.
Participation
Participation in the DEBS 2022 Grand Challenge consists of three steps: (1) registration, (2) iterative solution submission, and (3) paper submission.
The first step is to pre-register your submission by registering your abstract at Microsoft CMT (https://cmt3.research.microsoft.com/DEBS2022/) in the "Grand Challenge Track'' and send an email to one of the Grand Challenge Co-Chairs (see https://2022.debs.org/organizing-committee/ or the eval platform landing page). Solutions to the challenge, once developed, must be submitted to the evaluation platform (https://challenge.msrg.in.tum.de/) in order to get it benchmarked in the challenge. The evaluation platform provides detailed feedback on performance and allows to update the solution in an iterative process. A solution can be continuously improved until the challenge closing date. Evaluation results of the last submitted solution will be used for the final performance ranking. The last step is to upload a short paper (minimum 2 pages, maximum 6 pages) describing the final solution via the central conference management tool CMT. All papers will be reviewed by the DEBS Grand Challenge Committee to assess the merit and originality of submitted solutions. All solutions of sufficient quality will be presented during the poster session at the DEBS 2022 conference.
Query
This year’s DEBS Grand Challenge requires you to implement a basic trading strategy as it is used by intraday traders in real life. The strategy aims at (a) identifying trends in price movements for individual equities using event aggregation over tumbling windows (Query 1) and (2) triggering buy/sell advises using complex event processing upon detecting specific patterns (Query 2).
Background: Market Data and Quantitative Indicators
Trading on financial markets is fueled by precise real time event data together with reliable background information about financial instruments such as equities, indices or funds. The high-volume streams of event notifications reporting demand (ask), supply (bid), made trades (last) and other metadata are called market data. Nowadays, the overall amount of events published by the various exchanges and processed by technical solution providers like Infront Financial Technology (part of Infront group) is constantly increasing on a daily basis. For example, in 2019 Infront had been processing an average of 18 billion event notifications per day while in 2021 the daily average has already increased to 24 billion event notifications (c.f., https://www.springerprofessional.de/en/managing-the-complexity-of-processing-financial-data-at-scale-an/17436062 / https://arxiv.org/abs/1908.03206).
Leaving aside the special case of algorithmic trading, market data is provided to users at different levels of quality of information (QoI) depending on their subscription; quality attributes in this context refer primarily to granularity, timeliness and completeness, ranging from fine-granular tick data to end of day aggregations.
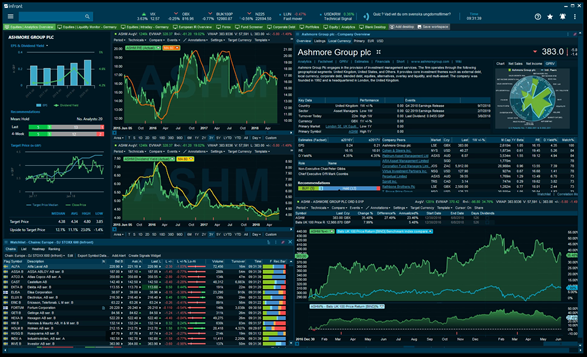
Traders, analysts, and other stakeholders utilize market data in interactive decision support systems called market data terminals to identify investment opportunities for specific sets of symbols they are interested in. The Infront Professional Terminal (IPT) as shown in Fig. 1 is a good example of such a terminal solution that fuses market data with metadata, news, interactive analytics, advanced visualization, and direct trading functionality.
Besides fundamental analysis, tracking and evaluating quantitative indicators is a widely-used approach by modern traders to identify trends in the development of an instrument’s price early on. Trends can be both upwards (i.e., prices increase) or downwards (i.e., prices start to drop). Identifying the start of an uptrend is crucial to be able to buy while the price is still low and to sell as soon as a downtrend begins (ideally: before it starts).
Important Definitions and Relaxations
For the remainder of this exercise, we define the following terms and relaxations to allow you to focus on the actual engineering aspects of the Grand Challenge:
Definitions
Relaxations
Formats
Query 1: Quantitative Indicators Per Symbol
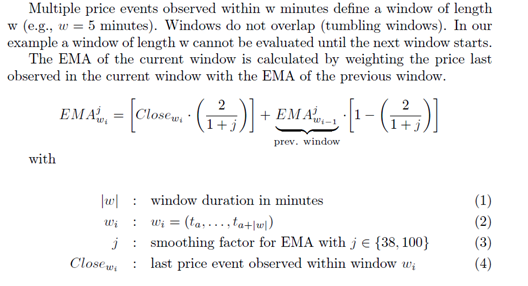
The first query defines one of the most essential indicators per symbol used in technical analysis to identify trends: the exponential moving average (EMA).
Query 2: Breakout Patterns via Crossovers
The quantitative indicators of query 1 will now be put to use in query 2: by tracking two exponential moving averages per symbol computed over different intervals we will be able to identify breakout patterns.
Breakout Patterns
Generally, breakout patterns describe meaningful changes in the development of a price that indicate the start of a trend (even if only temporary). Bullish breakout, if the price is starting to rise (aka breaking through the support area from below) and a bearish breakout if the price is going to lose steadily (aka breaking though the resistance area from above).
Properly identifying such changes and their nature in a timely manner allows a trader to monetize this knowledge by immediately buying (in case of a bullish breakout) or selling (in case of a bearish breakout) to maximize revenue.
Bullish Breakout Pattern: Buy Advice
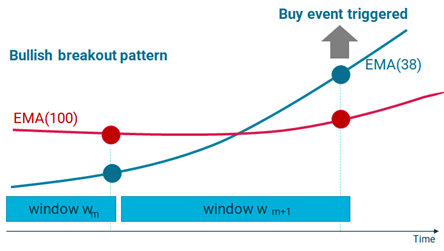
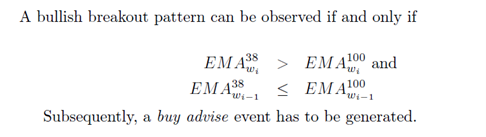
Generally, we detect a bullish breakout pattern for a symbol once the EMA with the shorter interval j1 starts to overtake the EMA with a longer interval j2. In this case, a buy advice event must be created immediately so that a trader can still benefit from a relatively low price.
For long intervals of j1=50 days and j2=100 days this crossover is specifically called a golden cross to indicate a golden opportunity for long-term investments.
For this challenge, we use a granularity of minutes by setting j1=38 and j2=100 and create a buy advice event upon detecting a bullish breakout as illustrated in the following figure and formalized as follows:
Bearish Breakout Pattern: Sell Advice
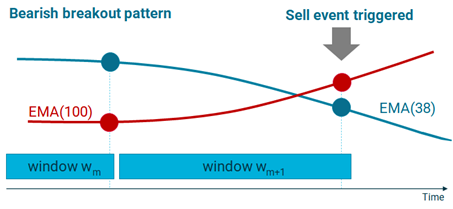
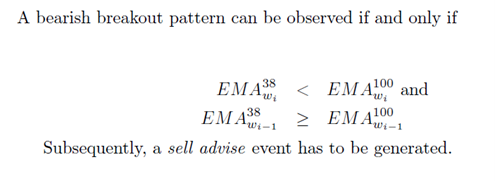
Generally, we detect a bearish breakout pattern for a symbol once the EMA with the longer interval j2 starts to overtake the EMA with a shorter interval j1. In this case, a sell advice event must be created immediately so that a trader can still sell at a relatively high price.
Conversely to the golden cross described earlier, a bearish pattern for j1=50 days and j2=100 days is specifically called a death cross. As for the bullish pattern, we use a granularity of minutes by setting j1=38 and j2=100 and create a sell advice event upon detecting a bearish breakout as illustrated in the figure below and formally defined as follows.
Responses Expected for Performance Evaluation
Verifying the correctness of your solution and competitively benchmarking will be done automatically by our central evaluation platform.
The Challenger Evaluation Platform
We provide a gRPC based API for the challenge. The documentation and example code is up on the challenge platform. Also a dashboard is available.
Send us an e-mail and we will grant you access to the platform. The platform is reachable under http://challenge.msrg.in.tum.de. Additionally, you can find further documentation and example code there to get started.
In the context of the evaluation we mimic the usual behavior of traders when using market terminal solutions: they subscribe to individual sets of symbols that they want to track and get informed about threats and opportunities (e.g., buy and sell advice events).
Subscriptions for Symbols
With every batch of events that is pushed to your solution you will receive a list of symbols that the eval platform subscribes to. This subscription is valid until it is updated (i.e., the current set of symbols is replaced with a new one). We will dynamically change the subscriptions.
As responses for query 1 we expect per batch the latest EMA(38) and EMA(100) for each symbol that our eval platform has subscribed to.
As responses for query 2 we expect per batch the last 3 crossovers (buy/sell) advises (with timestamps) for each symbol that we have subscribed to.
Consequently, you need to keep track of all symbols with their EMAs and crossovers to properly reply to our subscriptions.
Bonus: Smart Visualization
Whether humans in the loop can fully exploit a decision support system for trading does not only depend on the correctness and performance of its implementation; being able to visually cut through the noise and emphasize visually what is relevant to the user is almost as important.
Hence: try to find a smart way to visualize the results of the queries as a bonus! Be aware that participants for the Grand Challenge do also compete for the audience award -- and well-made visualisation adds magic to every solution.
Data Set Provided
The data provided for this Grand Challenge is based on real tick data captured by Infront Financial Technology GmbH for the complete week of November 8th to 14th, 2021 (i.e., five trading days Monday to Friday + Saturday and Sunday).
The DEBS 2022 Grand Challenge Data Set “Trading Data” and its derived (smaller) test data set are both licensed under a Creative Commons Attribution - NonCommercial - ShareAlike 4.0 International License (http://creativecommons.org/licenses/by-nc-sa/4.0/) . By downloading and using this data you agree to the terms and conditions of the licensing agreement.
The data set contains 289 million tick data events covering 5504 equities and indices that are traded on three European exchanges: Paris (FR), Amsterdam (NL), and Frankfurt/Xetra (ETR). All tick data events for security types equities (e.g., Royal Dutch Shell, Siemens Healthineers) and indices are contained as they have been captured on these days. However, some event notifications appear to come with no payload. This is due to the fact that this challenge requires only a small subset of attributes to be evaluated; other attributes have been eliminated from the data set to minimize its overall size while keeping the amount of events to process unchanged.
The full data set will be used for benchmarking the submitted solutions and published here for download after the submission deadline of the DEBS 2022 Grand Challenge.
The smaller test data set will be provided up front via our eval platform for testing purposes under the same license as the full data set. The test data set contains the first million event notifications that are relevant for the Grand Challenge queries. Consequently, participants must not pay attention to filtering out event notifications that do not contain attributes relevant to the Grand Challenge.
The attributes used in events in the data set are shown in Table 1; the attributes directly relevant for the Grand Challenge are marked in column three. Timestamps are in the format HH:MM:SS.ssss, dates DD-MM-YYYY, prices ##.#### (six digits).
| # | Attribute name | Attribute description | GC relevant |
|---|---|---|---|
| 1 | ID.[Exchange] | Unique identifier for this symbol with respective exchange: Paris (FR), Amsterdam (NL) or Frankfurt (ETR) | * |
| 2 | SecType | Security type: [E]quity (e.g., Royal Dutch Shell, Siemens Healthineers) or [I]ndex (e.g., DAX) | * |
| 3 | Date | System date for last received update | |
| 4 | Time | System time for last received update | |
| 5 | Ask | Price of best ask order | |
| 6 | Ask volume | Volume of best ask order | |
| 7 | Bid | Price of best bid order | |
| 8 | Bid volume | Volume of best bid order | |
| 9 | Ask time | Time of last ask | |
| 10 | Day's high ask | Day's high ask | |
| 11 | Close | Closing price ###.###### (six digits) | |
| 12 | Currency | Currency (according to ISO 4217) | |
| 13 | Day's high ask time | Day's high ask time | |
| 14 | Day's high | Day's high | |
| 15 | ISIN | ISIN (International Securities Identification Number) | |
| 16 | Auction price | Price at midday's auction | |
| 17 | Day's low ask | Lowest ask price of the current day | |
| 18 | Day's low | Lowest price of the current day | |
| 19 | Day's low ask time | Time of lowest ask price of the current day | |
| 20 | Open | First price of current trading day | |
| 21 | Nominal value | Nominal Value | |
| 22 | Last | Last trade price | * |
| 23 | Last volume | Last trade volume | |
| 24 | Trading time | Time of last update (bid/ask/trade) | * |
| 25 | Total volume | Cumulative volume for current trading day | |
| 26 | Mid price | Mid price (between bid and ask) | |
| 27 | Trading date | Date of last trade | * |
| 28 | Profit | Profit | |
| 29 | Current price | Current price | |
| 30 | Related indices | Related indices |
The events are provided through a GRPC based API:
message Event {
  string symbol = 1;
  SecType sectype = 2;
  float lasttradeprice = 3;
  google.protobuf.Timestamp lastUpdate = 4;
  google.protobuf.Timestamp lastTrade = 5;
}
Additional clarifications to queries will be provided here: https://challenge.msrg.in.tum.de/documentation
Awards and Selection Process
Participants of the challenge compete for two awards: (1) the performance award and (2) the audience award. The winner of the performance award will be determined through the automated evaluation platform (see above), according to the evaluation criteria specified below. Evaluation criteria measure the speed and correctness of submitted solutions. The winner of the audience award will be determined amongst the finalists who present in the Grand Challenge session of the DEBS conference. In this session, the audience will be asked to vote for the solution with the most interesting concepts. The solution with the highest number of votes wins. The intention of the audience award is to highlight the qualities of the solutions that are not tied to performance. Specifically, the audience and challenge participants are encouraged to consider not only the functional correctness but also the practicability of the solution.
Regarding the practicability of a solution, we want to encourage participants to push beyond solving a problem correctly only in the functional sense. Instead, the aim is to provide a reusable and extensible solution that is of value beyond this year’s Grand Challenge alone. In particular, we will reward those solutions that adhere to a list of non-functional requirements (see this document). These requirements are driven by industry use cases and scenarios, so that we make sure solutions are applicable in practical settings.
Thus, every submission will be evaluated for how it addresses our non-functional requirements in its design and implementation while assuming that all submitted solutions strive for maximum performance. In this regard, we distinguish between hard and soft non-functional requirements.
Examples for hard criteria are: Configurability, Scalability (horizontal scalability is preferred), operational reliability/resilience, accessibility of the solution's source code, integration with standard (tools/protocols), documentation.
Examples for soft criteria are: Security measures implemented / addressed, deployment support, portability / maintainability, support of special hardware (e.g., FPGAs, GPUs, SDNs,...).
In order to achieve all non-functional requirements, we want to encourage participants to build their solution not from scratch, but instead consider the widely-used industry-strength open-source platforms like those curated by recognized Open Source foundations (https://opensource.com/resources/organizations). We promote these platforms not only because they already have a diverse user base and ecosystem, but because most of them already solve non-functional requirements that are paramount for a use in practice.
There are two ways for teams to become finalists and get a presentation slot in the Grand Challenge session during the DEBS Conference: (1) up to two teams with the best performance (according to the final evaluation) will be nominated; (2) the Grand Challenge Program Committee will review submitted papers for each solution and nominate up to two teams with the most novel concepts. All submissions of sufficient quality that do not make it to the finals will get a chance to be presented at the DEBS conference as posters. The quality of the submissions will be determined based on the review process performed by the DEBS Grand Challenge Program Committee. In the review process, the non-functional requirements will receive special attention. Furthermore, participants are committed to present details on which non-functional requirements are indeed implemented and to what level of sophistication in their presentation slot. The audience will be encouraged to pay special attention to these details when making their votes for the best solution.
Important Dates (Tentative)
Grand Challenge Co-Chairs
Important Dates
| Events | Dates (AoE) |
|---|---|
| Abstract Submission for Research Track | |
| Submission Dates | |
| Research Paper Submission | |
| Industry and Application Paper Submission | |
| Tutorial Proposal Submission | |
| Grand Challenge Solution Submission | |
| Doctoral Symposium Submission | |
| Poster and Demo Paper Submission | |
| Notification Dates | |
| Author Notification Research Track | |
| Author Notification Industry and Application Track | |
| Author Notification Tutorials | |
| Author Notification Grand Challenge | |
| Author Notification Doctoral Symposium | |
| Author Notification Poster & Demo | |
| Conference | |
| Camera Ready for All Tracks | |
| Conference | 27th June – 30th June 2022 |
Sponsored by

and
and

and